


A child has epileptic encephalopathy. The epilepsy gene panel came back negative. Exome sequencing, which reads only the protein-coding 2%, found nothing. RNA sequencing from a blood draw was inconclusive. That's where a lot of rare disease cases stop.
The obstacle is arithmetic. Sequencing one person turns up 4 to 5 million differences from the reference, almost all of them harmless or unclassifiable. Nobody can look at 4 million things.
DeepMind's AlphaGenome Atlas, released on 8 September, ranked all of them for 814 families in the GREGoR Consortium rare disease cohort. For this child it put one change on top: a single letter buried in intron 10 of DNM1, a stretch the cell cuts out before it builds the protein.
Sixty-nine percent of that score came from the model's splicing predictions, pointing at glutamatergic neurons, the excitatory cells doing most of the brain's signalling. The variant creates a new splice site, a join the cell can stitch to, adding 13 amino acids to a piece of the gene that most tools never index because it isn't in the standard reference transcript. The model also predicted that piece is barely expressed in blood. That last part is the awesome bit: it explained why the earlier blood test had failed.
The team then mutated the 265 letters upstream of that exon and ran them through a reporter assay across five cell lines. Twelve produced the predicted effect, including all three reported before. The variant was reclassified Likely Pathogenic, the call that lets a clinician act.
A family that had been through a panel, an exome and an RNA test got an answer.
What shipped
The Atlas is a lookup table. DeepMind ran AlphaGenome over every possible single-letter change in the human genome, about 9 billion of them, plus more than 100 million insertions and deletions from gnomAD, UK Biobank and All of Us. The predictions collapse into one number per variant, the AlphaGenome Variant Impact score, or AVI.
It runs on 18 input features against the 150-plus in CADD v1.7, a comparison the paper makes itself, which is a number you only print when you're pleased with it. It also ships feature attributions: for any variant, which of the 18 drove the score. That's how the DNM1 case produced "69% splicing" rather than a bare number. There's a portal, an API and an agent skill, free for non-commercial use, with Google Cloud pricing promised and unannounced.
Precomputation is the genre norm here rather than the novelty. AlphaMissense, CADD and SpliceAI all ship precomputed tables, and somebody on the Hacker News thread put it better than I could: a model of this type either releases a precomputed database, or somebody else releases one for it, or it gets ignored. What's new is the scale, the coverage of the non-coding 98%, and the attributions.
What I wrote last year
Fourteen months ago I wrote AlphaGenome Attempts to Unify Genomic Analysis here, off the blog post. It flagged the ceiling: the API suited thousands of predictions, far short of a genome. The Atlas is the answer to that ceiling. Precompute once and the throughput question goes away.
That piece holds up. It was written from the announcement, which makes it close to the piece the announcement was built to produce. This time there was a preprint.
Three things sit in the paper and not in the blog post. DeepMind put all three there themselves. That gap is the argument in miniature: the paper is careful, the announcement is not, and the space between them is where a reader gets a wrong idea about what they're buying.
Against the tools you already run
The benchmark the coverage repeated is ClinVar, the public database of variants human experts have classified as pathogenic or benign. On intronic variants there, AVI scores 0.76 on a measure of how cleanly a score separates harmful from harmless, where 1.0 is perfect. The next best model scores 0.44.
Now the other benchmark. Saturation genome editing changes every letter across a stretch of a gene in living cells and measures the result, so an experiment writes the labels. Across ten screens the model never saw in training, AVI scored 0.668 against CADD's 0.647.
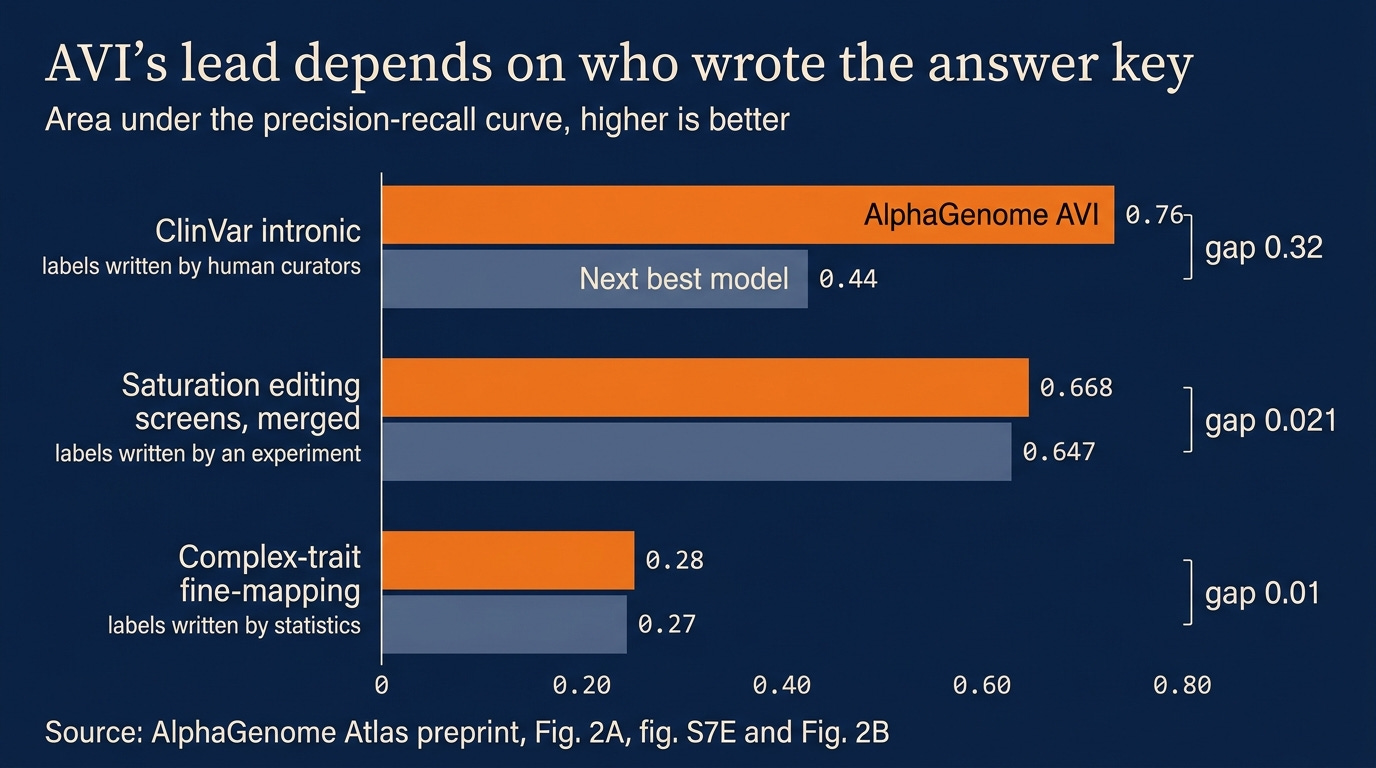
0.32 of daylight in one place. 0.021 in the other. One of those is Figure 2. The other one is in the supplement.
The difference is who wrote the labels. Under the ACMG/AMP guidelines the field runs on, a curator classifying a ClinVar variant may weigh computational predictors as supporting evidence, and CADD and SpliceAI are the ones sitting on the desk. A model trained to agree with CADD will beat CADD on a test where CADD helped write the answer key. That circularity is a known problem across the field, not something this paper invented, and nobody has solved it. Where an experiment wrote the label, the gap nearly closes. The ClinVar number is Figure 2A, main text, and every writeup quotes it. The editing number is figure S7E, in the supplement, and nobody does.
The second number is about your pipeline. Ranking known pathogenic variants in solved rare disease cases, AVI recovered 29.5% in its top 50 against CADD's 12.5%, which is the 2.4x headline. Filter on gnomAD allele frequency at 0.001 first, which every clinical pipeline already does, and the two go to 74.3% and 61%. AVI still wins. The margin is 1.2x.
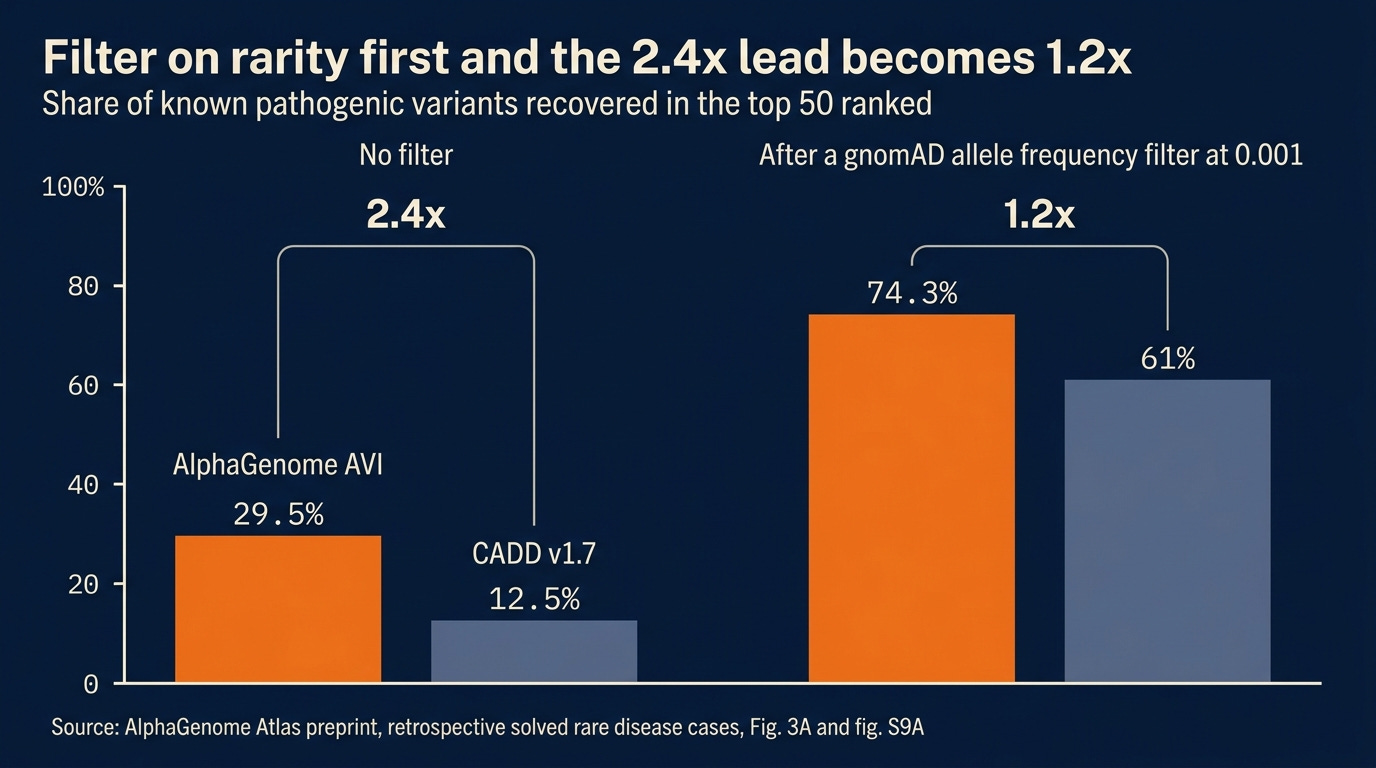
That collapse is the third thing, and it reframes the other two. AVI is trained on allele frequency as a stand-in for harm. Variants seen in more than 1 in 1,000 people get labelled benign for training, rarer ones impactful. The paper's own Figure 1 caption calls these proxy labels. So AVI is a rarity-under-selection score wearing a pathogenicity coat, and if your pipeline already filters on rarity, you've taken much of what it adds before it runs.
AVI ranks by predicted rarity. Rarity tracks harm closely and it is not the same thing.
Third, the association result. The blog says the Atlas uncovered 22% more non-coding associations. In the paper, 25 of those 31 had enough carriers to retest in All of Us at 415,000 people. Four replicated at nominal significance. None survived correction for multiple testing. Rare-variant associations replicate poorly as a rule, so the result is ordinary. It's still absent from the version most people read.
Every number above is theirs
DeepMind reported all three of those themselves. They held out ten editing screens they could have trained on and printed a margin of 0.021. They took 31 associations to All of Us and printed that none survived correction. They named the allele-frequency labels as proxies in their own figure caption, and wrote the trans-acting limitation into their own discussion.
A group chasing a clean headline runs fewer tests. This one ran more.
The paper is careful and the announcement is not. Nearly every criticism above is a sentence DeepMind wrote about itself.
The DNM1 case earns more credit than it gets, too, because it closes a loop most methods papers leave open. The model ranked the variant. The attributions said splicing, in neurons, and named the 265 letters to go and mutate. The assay ran across five cell lines. Twelve variants behaved as predicted. The variant was reclassified and a clinician could act. Prediction to bench to clinical call, one paper, one family. That is hard, and most groups don't attempt it.
What it changes on a Monday
The Atlas shortens lists, and on a Monday that is most of the job. Four million candidates down to a page a person can read is the bottleneck, and this clears it. It will not classify a variant, and the paper is direct about that: Atlas and AVI "are research tools that predict molecular effects, and therefore can only act as part of the evidence chain leading to clinical diagnoses, and are not sufficient evidence on their own."
Computational evidence enters a clinical call through the ACMG framework, and how much weight any one tool gets depends on a calibration by the ClinGen Sequence Variant Interpretation working group. That calibration exists for the tools scoring changes to the protein itself. The Atlas paper asks the community to establish the same for non-coding variants, citing Bergquist et al. in Genetics in Medicine, 2025. Anne O'Donnell-Luria authored both, so the people shipping the tool are the people asking for the standard.
So AVI can move a variant to the top of your list today. It can't be cited as evidence at a defined strength.
The second point comes out of the Atlas's own success story. SpliceAI would have scored that DNM1 region correctly: the paper measured it at 0.940 against the experimental data, near-tied with AlphaGenome's 0.943. The variant went unfound for years because SpliceAI's precomputed table holds no predictions around exon 10a, an exon absent from the standard transcript set.
The model was fine. The table had a hole in it.
Every precomputed resource inherits the blind spots of the annotation it was built against. The Atlas is one frozen model version on one reference genome, so it'll have holes of its own: not a wrong answer, an absent one. I wrote about this in The Wrong Tool Problem in Genomic AI.
So: use the ranking to decide what to open first. Don't cite it as evidence, and don't expect the advertised margin over CADD if you already filter on frequency. Then use the attributions to pick the experiment. That's the new part. "69% splicing, in neurons" tells you to go build a splicing assay. Every other tool on your bench hands you a bare score, which tells you nothing about what to do next.
The clinical geneticists I've worked with never asked for a better score.
They wanted a shorter list they could defend to a lab director. That is a different product and a harder one to build.
Oncology and complex disease
The cancer evidence is the strongest in the paper, and it sits on the germline side. Of the ten held-out editing screens, seven are cancer predisposition genes: BRCA1, BRCA2, BAP1, VHL, BARD1, PALB2 and XRCC2. So that modest 0.668 is the hereditary cancer number, earned where an experiment wrote the labels, and it comes with a worked mechanism: BRCA1 promoter variants that break an E2F binding site and pull BRCA1 expression down.
Somatic cancer gets one demonstration: more than 70,000 somatic variants in oral epithelial cells, where high-AVI hits in the TP53 3'UTR and the AJUBA promoter landed on clusters already under positive selection. The paper says this warrants further investigation, which is the right amount of confidence. The Atlas scores the reference genome. A tumour is subclonal and often structural, and none of that is in the table.
Cardiology is absent. "Heart left ventricle" turns up as one cell type in the model's tissue panel and nowhere else. Complex disease is the weakest column, 0.28 against 0.27 on fine-mapped GWAS variants, and the paper names the reason: AlphaGenome "does not directly model trans-acting mechanisms such as changes in TF expression, which mediate a substantial proportion of complex trait heritability." It reads the grammar at the variant. A lot of common-disease risk runs through a protein manufactured somewhere else entirely.
The 22% headline was circulating protein levels in 54,189 people. That is a molecular readout, a long way from a cardiac endpoint.
The other complete mutagenesis
About six weeks before the Atlas, a group at the Centre for Genomic Regulation, the Sanger Institute and King's College London published the complete mutagenesis of ΦX174, a virus that infects bacteria: every nucleotide of its 5,386-letter genome and every amino acid of every protein, measured at the bench. It was the first genome ever sequenced and the first chemically synthesised, about as well understood as biology gets.
Half of nucleotide changes and more than 60% of amino acid changes impaired fitness. One in four of the damaging ones has no mechanistic explanation. A section of that paper is headed "Mutational effects are not well predicted by AI models". Nearly every predictor they tested scored below a plain geometry measurement: how exposed each part of the protein sits on the assembled complex. Geometry, no model involved, median correlation 0.41 against 0.31 to 0.34 for the protein language models. The authors call the result humbling.
That paper tested protein variant effect predictors, not AlphaGenome and not AVI. It's a virus, the authors name under-representation of viral sequences in training data as a partial cause, and it measures fitness in a phage assay, not human disease. A phage is not a child with seizures.
Take it as a calibration point, and notice the Atlas team's instinct runs the same way. They held out those ten editing screens for the reason ΦX174 is worth reading: a measured label can come back and tell you you're wrong, and a curated one mostly agrees with you. Two papers, same scarce thing.
What is scarce
Two papers this summer used the phrase complete mutagenesis and meant different things by it. One is 9 billion predictions and a petabyte of storage. The other is 5,386 positions somebody measured. Only the measured one can come back and tell you you're wrong.
The table is useful and I expect to use it. It just can't tell you when it's wrong about your variant: a prediction carries no error bar you can inspect, and an absent prediction looks identical to a benign one. You find out when somebody runs the assay.
DeepMind calls the Atlas a baseline rather than an endpoint, and this is a paper that has earned the right to ask for the next one. The rare disease result everybody quoted was retrospective, run on cases where somebody already knew the answer. Run it forward. Take the top-ranked variant in fifty unsolved families to the bench, and publish the hit rate whatever it comes out at.
That number would tell us something no benchmark can, and it's the one the families are waiting on. Nine billion precomputed predictions is a serious shot at moving it.
Related: The Specialist Is Now You on doing variant interpretation yourself, and The Harness Is the Moat on why the tooling around a model outlasts the model.